When people quote the returns of the S&P 500, they like to use the 'price return', as if price returns are the only way that stocks in the S&P 500 can make you money. As you can tell by my sarcastic writing - you're neglecting a pretty big portion of returns - namely, in the form of dividends. In this article we present the 2012 S&P 500 Return calculated correctly.
The 2012 S&P 500 Return
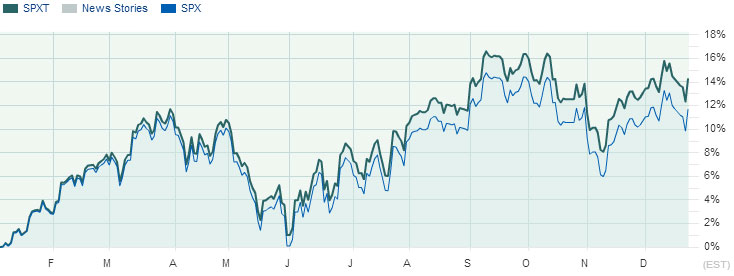
2012 S&P 500 Return: Price vs. Reinvested Dividends
You're looking at the S&P 500 graphed next to SPXT (on marketwatch), the S&P 500 total Return Index. That's right - dividends included. So, all of you who quote the S&P 500 in the future, please use the right index. That ticker goes back to 2009. If you need it on a larger time frame, you can check out the dividend reinvestment calculator for the S&P 500 (like, say, 1876 until today?) right here on this very site. You're welcome!
PK started DQYDJ in 2009 to research and discuss finance and investing and help answer financial questions. He's expanded DQYDJ to build visualizations, calculators, and interactive tools.
PK lives in New Hampshire with his wife, kids, and dog.
DQYDJ may be compensated by our partners if you make purchases through links. See our disclosures page. As an Amazon Associate we earn from qualifying purchases.