
32.39% was the 2013 S&P 500 Return, not the 29.60% you'll see quoted on tons of other sites.
We told you last year, but we'll obnoxiously repeat the lesson once again: dividends matter. While every other web site on the internet gives you the price returns of the S&P 500, we do the extra step and tell you both types of returns: price returns and dividend reinvestment returns.
2013 S&P 500 Return
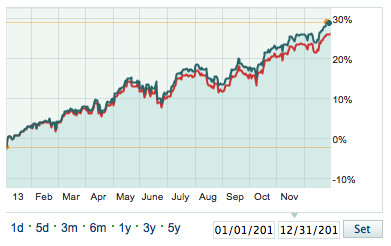
2013 S&P 500 Return: Reinvested Dividends vs. Price
Dividend reinvested returns in green, index returns in orange.
We've heard plenty of arguments to the contrary, but they all fail for the same general reason: it makes no sense to consider index returns without doing something with the dividends. Yes, SPXT isn't a perfect comparison (it ignores taxes and trading fees to list two issues), but it's vastly superior to ignoring dividends altogether.
So, once again, when you look at the S&P 500, please use the S&P 500 Total Return Index, graciously provided by S&P to fix this commonly made error. For longer time frames, Don't Quit Your Day Job has a S&P 500 Reinvestment Calculator which uses Robert Shiller's data back to 1871 (and, hilariously enough, covers times when the S&P "500" wasn't 500).
| 1/2/2013 Open | 12/31/2013 Close | Annual Return | |
| S&P 500 Total Return | 2504.45 | 3315.59 | 32.39% |
| S&P 500 Price Return | 1426.19 | 1848.36 | 29.60% |
Other years:
