
Hey folks, I feel like I dropped the ball on this one - I had wanted to write this update of our adjustment series when the S&P 500 nominally closed over 2000 - but let me make it up to you with a little information on recent movements. You see, although July 23rd had been holding the 'actual adjusted closing high' crown, we've actually recently busted through the adjusted return plateau - starting 8/20/2014, every close has been above the late July local maximum.
Actual S&P 500 Returns - Inflation Adjusted, Dividends Reinvested
Inflation is CPI-U, I pull it from the BLS via the St. Louis Fed and extrapolate for future inflation from the last 5 months (for individual day estimates). S&P 500 Total Return is an index produced by S&P.
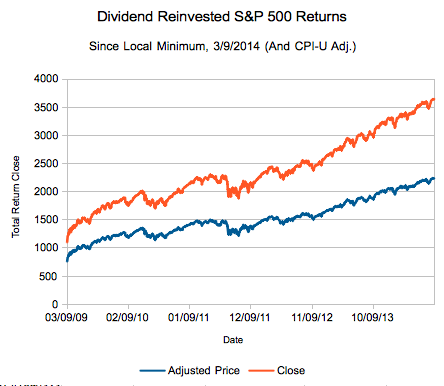 Orange is nominal close, and blue is the hero of this series, the adjusted close - adjusted back to January 1993 (for a neutral, bit more than 20 year time period). The chart starts on March 9, 2009 - the local minimum for the current bull market.
Here's the stats if you actually called the exact bottom:
| Adjusted Close | Adjusted Annualized Return | Nominal Close | Nominal Annualized Return | |
| 03/09/09 | 753.9 | - | 1095.0 | - |
| 09/05/14 | 2243.1 | 21.95% | 3652.3 | 24.50% |
So, did any of you call the exact/near bottom? How have you performed since then?
