
We got an interesting question about our last piece on high yield corporate bonds, asking whether bond spreads predict stock returns. As the spread between highly rated AAA corporate bonds and below investment grade bonds has recently widened, that sort of information would be worth keeping in your back pocket as you lay out your current investment strategy in the midst of volatile equity markets.
I didn't do a terribly deep dive, and I didn't attempt to eliminate all confounding variables - certainly, if you think this is worth looking into (let me know!), you'd want to at least throw CPI and the Effective Federal Funds rate into the mix. However, as an initial cut, I wanted to come back with a graph showing how the current day yield spread compares to five year subsequent returns on the (price index) S&P 500.
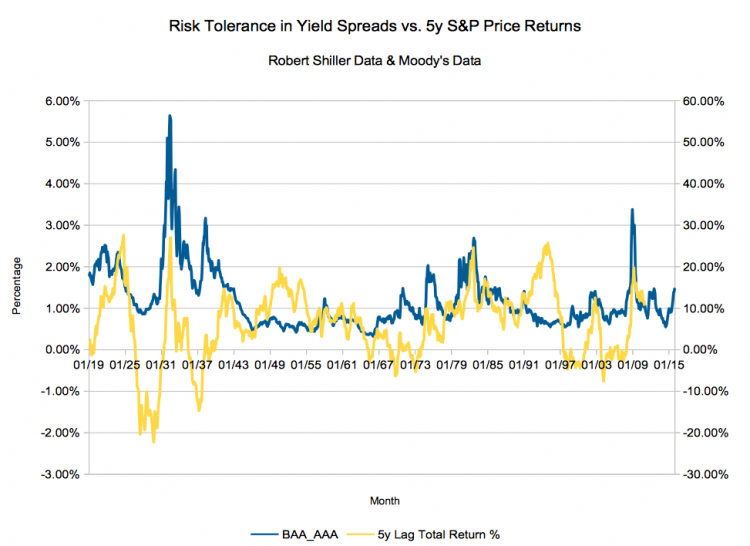
Corporate Bond Spreads versus S&P 500 Price Returns
Today we are using two Moody's indices, their AAA and BAA corporate bond yield indices - the Merrill Lynch Bank of America series only go back to the mid 90s (and, again, this is just an initial cut). Although that spread won't be as dramatic as a junk versus highest grade comparison, it will give us an idea of when the spread itself was widening. We mashed it up with Robert Shiller's S&P 500 return data (he extended the series well before the S&P 500 existed). Here's what it looks like:
Can bond spreads predict stock returns?
(5 Year Returns are on the Right Axis, the Baa_Aaa spread is on the left axis.)
For a quick look at total returns, we have a calculator which does dividend reinvestment math on the S&P 500 as well as one for Junk Corporate bonds.
Can Bond Spreads Predict Stock Returns?
It's tough to say exactly whether the relationship means anything - certainly during the two most notable financial crises in the Great Depression and the Great Recession you would have seen excess returns. The early 1980s also would have seen some nice returns after the widening spread.
However, just eyeballing the chart shows excess returns after WW2 without any sort of a large risk spread, as well as in the 1990s.
My conclusion? Shake your Magic Eight ball (or do the math with different timeframes).
Reply Hazy Try Again
