
If you recall, in our last article we calculated historical risk spreads between various asset classes. Not content to leave that topic in an unfinished state, here's the results of some further calculations - this time looking at debt vis-a-vis itself - we compare last week's asset classes to inflation expectations at the time...
(Oh, you didn't think you'd be getting a piece this week? This is our gift to you - enjoy it in good health.)
The True Risk Spread Premium
We told you last week that we were calculating the risk spread premium between asset classes and using the 10 Year Treasury as our go-to benchmark. However, as investors one of the things we keep a wary eye on is inflation (our daily inflation calculator is here).
Inflation is the bogeyman of our investing journeys - numbers that seem large in isolation may be quite tame when compared to realized inflation.
Let's arrest that realized inflation thought right there though - you don't know what inflation will be like over the term of your investment. However, you can guess what it might be with a little help from the market in swaps and (recently) TIPS. For this article, we chose the Cleveland Fed's data, which goes back to 1982 (methodology). Long time readers will recognize the similarities to our "new mortgage perspective" series we revisit occasionally. Other informed readers will know we have our own automatically updating inflation forecast here.
Just like last time, we get our AAA and BAA bond date from Moody's, and our 10 Year Treasury data from Robert Shiller. Again we have a minor caveat - we use 10 year expectations for normalizing our Treasuries, and 30 year expectations for the AAA/BAAs.
A Retrospective
Remember in the last piece when we said that, historically, AAAs looked best? They only looked best in comparison to 10 Year Treasuries and BAA corporate debt.
From the perspective of 'return after expected inflation'?
They all look pretty bad.
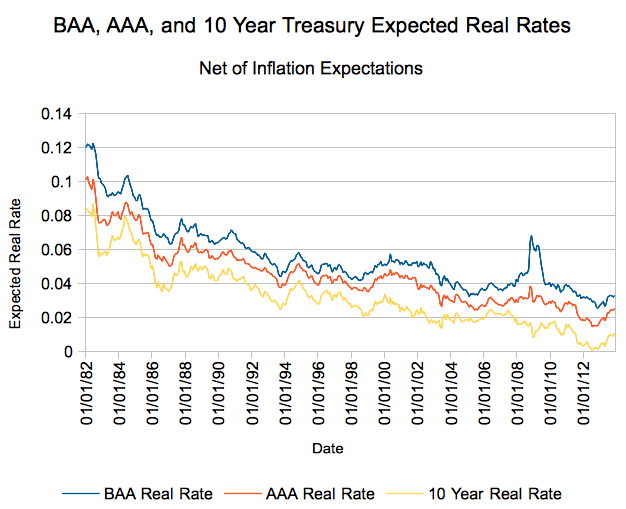
Now, take this with a grain of salt - there is no elemental law that says certain debt should cost a certain amount more than inflation is expected to run. Also... this data only goes back to 1982. What we can say is since that time there has been an obvious trend towards a tightening of yields and inflation expectations. (Yes, and it's possible junk bonds were undervalued back in the 1980s!)
Even the recent Great Recession only drove BAA yield premiums back to 1990 levels and AAA premiums to 2002-2003 levels. Still, it's possible we start trending upwards - in July, 2012 we hit a local bottom with a .04% annual premium expected on 10 ear Treasuries and a 1.44% premium on AAA issues. BAA hit a local minimum 4 months later in November, with a 2.54% premium.
"There's No Such Thing as a Free Lunch"
Mr. Heinlein is right - or at least in the current environment. Perhaps there was a free lunch for the taking at some points over the last 30 years, but you aren't going to find it in 10Ys, AAAs, or BAAs today.
For your enjoyment, here's a statistical retrospective on rates versus expected inflation (assuming it means much to pull these stats - I'm not so sure it does):
| BAA Real Rate | AAA Real Rate | 10 Year Real Rate | |
| Average | 5.57% | 4.49% | 3.18% |
| Median | 5.11% | 4.27% | 2.87% |
| Maximum | 12.26% | 10.30% | 8.70% |
| Minimum | 2.54% | 1.44% | 0.04% |
| Current (11/13) | 3.27% | 2.52% | 1.08% |
Happy holidays!
