
Ever since China's stock market started to swoon 28 days ago, I've wondered what a good comparison for it was - I'm gathering information on the parallels between China's market and other market history, but I wanted to share a quick cut using closing prices on a subject many of us our familiar with. Since it's information reasonably fresh in my (our?) mind(s), I first compared closing prices on the Shanghai Composite since their closing peak on 6/12 to the closing prices of NASDAQ one year before to one year after the 'tech bubble' burst. It's a match...
You've heard the old yarn: "History may not repeat itself, but it does rhyme". Indeed, it does - often in creepy ways, and sometimes in a single generation (15 years is still less than a generation, right?).
China Stock Market Action vs. the Tech Bubble
It's too soon to say if we're watching a major bubble bursting in China - even though we've seen 30+% losses in under a month, the tech bubble saw 62% nominal losses in a single year(!). For those of you who don't have the NASDAQ's (for the uninitiated, NASDAQ is where many technology firms list their securities - and it was even more dominant 15 years ago) chart burned in their head, here it is based on days before/after the 3/10/2000 peak:
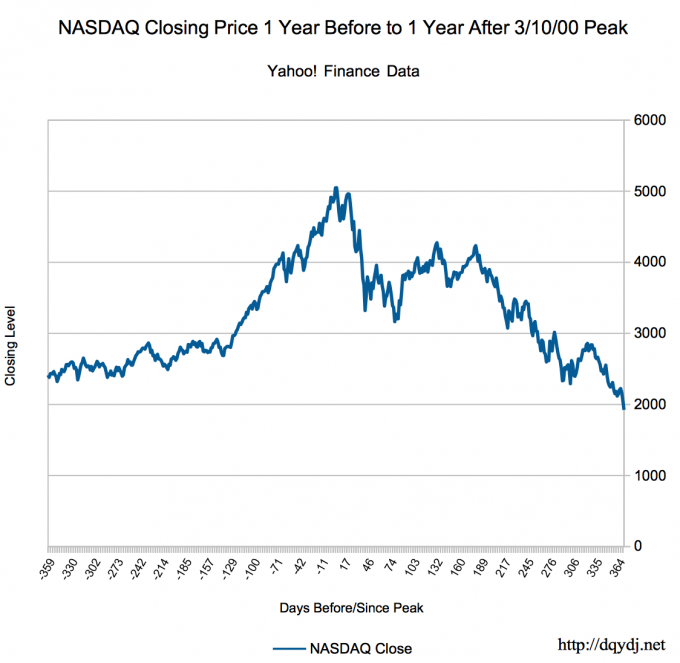 Ugly price action, isn't it? There's no way we'll see something similar in our lifetimes... right?
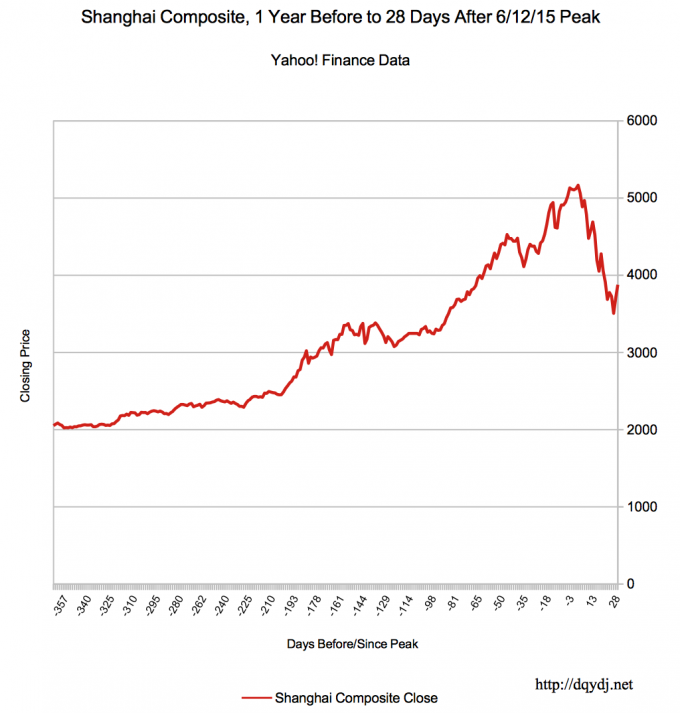
And now, the Shanghai Composite's closing price action from one year before the peak until 28 days after:
This Time is Different?
The Governmental responses may be different - and we'll follow up on those in another piece - but the charts are creepily (it's an investing term) similar. Both are unadjusted, not even to match the peak levels - they really are that similar, so far.
Here's what the maximum and minimum closing prices look like in the 365 days before the respective peaks:
| NASDAQ | Shanghai Composite | |
| Closing Peak | 5048.62 | 5166.35 |
| Minimum Closing, Previous Year | 2322.84 | 2023.73 |
So, how do you think this will all shake out? Is the Shanghai Composite having it's 2000-NASDAQ moment?
