
On this page is a Workforce by Generation Calculator which shows the working population in the United States... but scaled by the Generation. It currently contains data for 1962-2015 with annual resolution.
If you disagree with our generation starting and ending dates, you can adjust them manually and rerun the calculations. When you are satisfied with your work, export your calculations to CSV and manipulate the data in your favorite spreadsheet program!
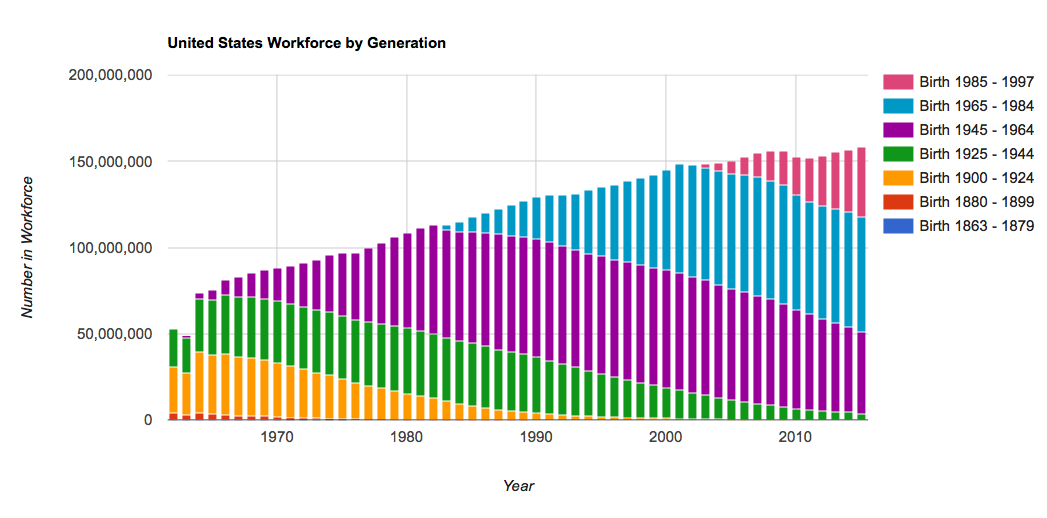
The United States Workforce by Generation Calculator
Starting Values - What Years Did Generations Start and End?
These are just what I started with, I fully expect and anticipate you'll change them. However, I feel they're reasonably defensible as a first cut:
- Millennials: 1985 - 1997*
- Generation X: 1965 - 1984
- Baby Boomers: 1945-1964
- Silent Generation: 1925-1944
- Greatest Generation: 1900-1924
- Lost Generation: 1880 - 1899
- Unnamed Generation**: 1863-1879
*We're only using 18+ workers, so I didn't have to worry about the youth. Millennials are the last in the graph, even though they technically aren't the youngest in the workforce (even if it's a rounding error).
**Suggest a name if you wish - as far as I can tell, the naming trend started with the Lost Generation which was coined by Gertrude Stein and popularized by Ernest Hemingway. The Population Reference Bureau suggests 'New Worlders' and 'Hard Timers'.
Using the United States Workforce by Generation Calculator
There's nothing more contentious in demographics than deciding when, exactly, things started - so we tried to remove ourselves from the conversation by making it adjustable. Please adjust it!
Tool Inputs
- Year Range Slider - You can move the birth years left and right to better fit your definition of when the generations started.. NOTE: leave a one year gap between generations because the calculator years are inclusive.
- Breakdown Type - By default we show relative numbers, but you can also use absolute numbers for the workforce which will show the workforce itself growing over time. Whichever you pick, just hit the Recalculate button and DQYDJ will redo the chart for you.
Tool Commands & Output
- Recalculate and Draw Chart - When you're happy with the generational inputs, click the button to redraw the graph.
- Reset - Resets all inputs to the (possibly controversial) ones we started with at page load.
- Download Current to CSV - once you have recalculated, I wouldn't want you to lose your work - so download it as a CSV.
- Remove all Generations - Do we have too many generations in the tool? Not enough? Screw up? Hit this button to start from scratch.
Methodology and Source for the Workforce by Generation Calculator
Miriam King, Steven Ruggles, J. Trent Alexander, Sarah Flood, Katie Genadek, Matthew B. Schroeder, Brandon Trampe, and Rebecca Vick. Integrated Public Use Microdata Series, Current Population Survey: Version 3.0. [Machine-readable database]. Minneapolis: University of Minnesota, 2010.
You can see details on importing this data into R to export it to a spreadsheet. We don't always (read: never have before) go into that much detail, but it will help you understand where we got this data, and how you can reproduce the set. (Or, hey, just download it from there.)
Other Reading on Demographics and Scaling for a Changing Workforce
Recently, we've given you a few calculators which do the tedious math of adjusting for workforce demographic changes. (See them if you haven't: Adjusting Average Incomes for Demographics, Workforce By Age Calculator for the United States, Income Earned by Age Group).
As we warn you with all of these calculators, we like to make sure you're comparing apples to apples - or even apples to oranges instead of tractors (at least they're round fruits, people). We try to start you on that path with some of the adjustments, but it's important to try to think of all confounding variables - demographics, immigration, outflows, inflows, war, trade agreements, changing household makeup, and whatever else is out there (Leap years? Daylight Savings Time? Snow?)
At DQYDJ we host a bunch like this:
- Workforce by Age Calculator - Same data, but uses age (a far less controversial formulation!).
- Average Income Scaled to Demographics of Other Years - It uses the exact same data set for a fair comparison of average income over time.
- Net Worth by Age Calculator - Uses SCF 2013 data and lets you check an age versus a net worth - much more useful than comparing to aggregate data which includes all ages!
- Income by Age Calculator - Income centiles don't mean much when you compare a 47 year old to a 22 year old - this calculator lets you compare incomes to others of a particular age.
On other topics? You can find them all on this page. There are a lot, so bookmark it and come back on a long weekend.
Go have fun and let us know if you found anything interesting in the comments!
