
On Monday, we discussed how to quickly determine the rough inflation expectations in the general market, at least when it comes to CPI. We also linked you a calculator we built which calculates inflation expectations over various timeframes.
All that is well and good - but what can you actually do with that information?
Therein lies the trick, dear reader. Read on for how to judge the cost of debt versus your true costs.
Your True Cost of Credit
When we look back a past market performance and inflation, we're doing exactly that - looking backwards. It's all well and good to look at inflation and US Treasury debt from the late 1970s and say "that's an excellent deal". It's another thing altogether to do it contemporaneously!
Here's the argument - the proper way to determine if some debt instrument is expensive or cheap is to compare the real rate of return - or in this case, the expected real rate of return from a point forward. Read: you don't have 20/20 hindsight when you actually go to get a mortgage or a car loan, you only have whatever information exists in the moment.
That's where this measure comes into play. A 14% 30 year mortgage is a joke in current conditions, where (as of the publishing date of this article) the market is pricing about 2% inflation over the next 30 years. That means, roughly, a bank is planning to pocket 12% real returns - a massive amount, even when compared to a stock index like the S&P 500 or Dow Jones Industrial Average.
(Of course, 14% is also a joke when the prevailing 30 year rate is around 3.67% - as of 5/2/2015. But you get my point - if mortgages were averaging 14% right now, it would make buying houses on credit incredibly expensive.)
Mortgages versus Inflation Expectations
We're going to show you an interesting graph - mortgage costs for a 30 year loan versus 10 year inflation break-evens - determined in the same manner as we detailed last article.
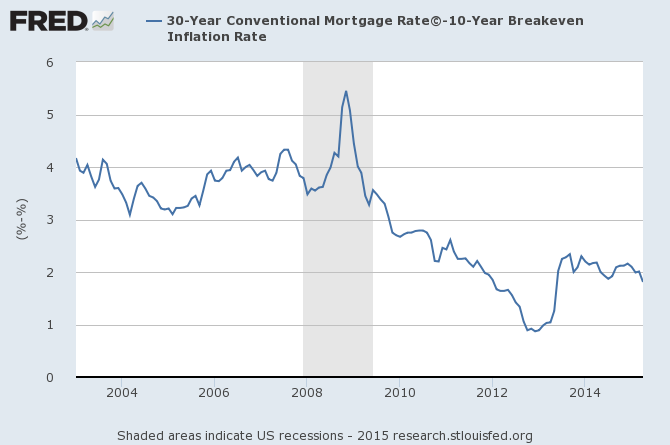
Mortgage data is from Freddie Mac, and treasury data is from the Department of the Treasury (of course).
Why Did You Pick 10 Years?
Pretty arbitrarily, actually - the average life of a loan used to be quoted as 7 years. In this low interest rate environment, I imagine rates won't drop as quickly as they have in the last 30 years. That leaves one less reason for new mortgages - refinancing to hit a lower rates.
Of course, other reasons still exist - buying a new home, funding a renovation, patching cash-flow issues, buying a boat, buying more cars, sending kids to college and the like...
The True Cost of Credit
If you take anything from this article, just note that pricing is relative. Just as you shouldn't brag about your 1% gain on a tech stock you bought in 2000, it's all relative when it comes to the cost of debt. 14% might be a bad rate today, but it was much more competitive in the last 1970s when folks expected many more years of high inflation.
And, of course, the whole exercise revealed something interesting - your true mortgage cost is about 2% today, the cheapest it has been since 2013... but not really close to its all time low. If you took out a mortgage in 2013, congrats - you got the cheapest mortgage in history, at least by this measure!
