
When we published our real expected return research on BBB and AAA corporates (as rated by Moody's) and Treasuries, we knew we'd leave readers a bit wanting. Although we had wanted to take that piece further, we were limited by the data available to us and our sad lack of a research assistant (if you're interested, the pay is non-existent, but the projects are numerous!). Here's our belated effort on that front.
Corporate Debt Total Return by Grade
We scaled back our ambitions a bit and looked at some series that have been published since the end of 1996, thanks to Bank of America Merrill Lynch (they are syndicated at the St. Louis Fed's excellent FRED site). BoAML has total return indexes for AAA, AA, A, BBB, BB, B, and CCC and under corporate debt - total return meaning 'if all coupons were reinvested, ignoring tax and transaction fees, here's what you'd have'. A step up from normal price indexes, if a tiny bit realistic - but indexes like that (all of our investment calculators are here) have become DQYDJ's bread and butter.
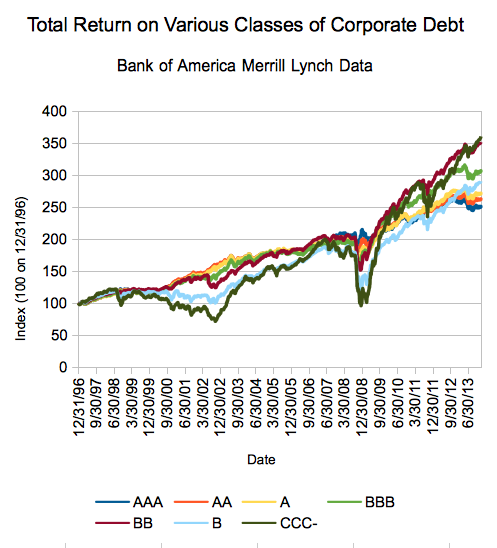
Bank of America Merrill Lynch corporate debt total return indexes
All the returns you see graphed above are daily and based on an index level of 100 for 12/31/1996.
Since we were asked a few times, I'd say our key takeaway is that surprise runner up finisher, BB debt. Sure, this dataset could only legally drive in some states if it were human, but those 17+ years did deliver a decent surprise. CCC- also showed an impressive return along with some scary drops - at one point being down almost 30% from the start (and that's with the reinvestment, remember!).
Corporate Debt as an Investment (Versus, say, Stocks?)
Sick of certificates of deposit, 1% savings rates, or even treasuries? Here's our math on the total returns on everything in the BoAML universe, plus our own calculations of the total returns of the S&P 500 (our calculator here), the Wilshire 5000 (our calculator here), and 10 Year Treasuries (our calculator here) since that fateful 12/31/1996 date (through 1/9, if you're wondering when I retrieved the data):
(Note: 10 Year Treasuries rounded to nearest month, Dec 1996 to Jan 2014, and S&P 500 Numbers using the S&P 500 Total Return Index).
| Total Return | Annualized Return | |
| AAA | 151.14% | 5.55% |
| AA | 162.58% | 5.83% |
| A | 171.57% | 6.04% |
| BBB | 206.54% | 6.80% |
| BB | 251.62% | 7.66% |
| B | 190.66% | 6.46% |
| CCC- | 260.54% | 7.82% |
| SP 500 | 238.73% | 7.42% |
| Wilshire 5000 | 254.64% | 7.71% |
| 10 Year Treasuries | 103.30% | 4.24% |
Thoughts?
Yes, I'm also surprised by the BB results.
So, what's next? Daily return calculator for corporate debt? I'm undecided - help guide my time. You know, unless you can send me a research assistant.
