
It annoys us to no end that when people quote market returns, they generally will only use nominal returns, and ignore the effects of inflation. This discounts the way most of us live - when we take money out, we do so in order to spend at current market prices, not past prices. When we invest in mutual funds, they generally roll our dividends back into the fund.
With that in mind, we've created quite a few calculators in this style - a calculator which computes dividend reinvested returns for any stock, one for the S&P 500, and one for the Wilshire 5000, to list just three - but we can still find too many examples of the financial press still getting it wrong.
Well, dear reader, you don't have to. We've crunched the numbers for the last 20 years (and change - January 1994 to July 3, 2014) to show you what real investors wold have made if they just tossed a lump sum into the pot two decades ago and reinvested the returns. the normal caveats apply: if this was in a taxable account, you'd have to pay taxes, and unless you run the fund you'd pay expenses too - but this math is still closer than anything else you'd find on the internet.
The Last 2 Decades of S&P 500 Market Returns
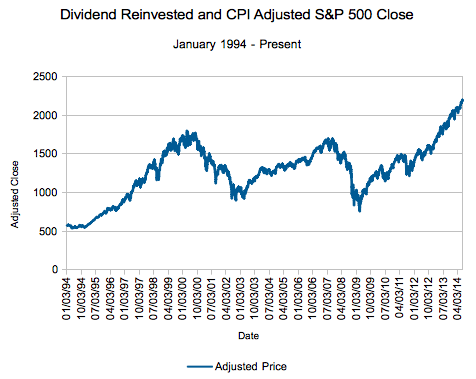
S&P 500 Total Returns come from S&P, and the inflation adjustment is the CPI-U from the BLS, retrieved from FRED. Our methodology for extrapolating inflation can be found in our daily inflation calculator. January 3, 1994 is our benchmark date for the relative levels, and we calculated a S&P 500 Reinvestment/CPI level of 567.095 at close on that date, for a CPI of 146.326. (All other math can be extrapolated from that reading.)
Let's zoom in a bit on this year:
 Your Actual Returns
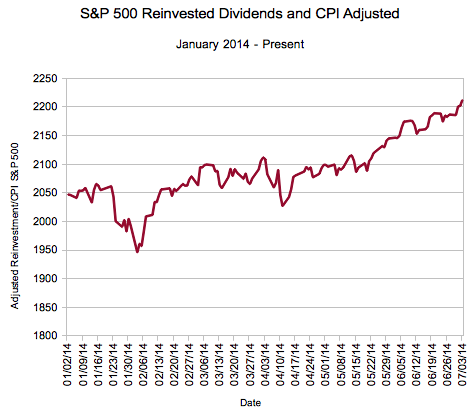
So, yes, recent days are actual all time highs, even accounting for inflation - investing is keeping you ahead of the game if you are reinvesting your funds.
As for actual returns, here's what you're looking at, calculated both if you had invested a lump sum and reinvested from January 2, 2014 until today or January 3, 1994 until today:
| For Ending Date 7/3/2014 | ||||
| Start Date | Nominal | Real | Nominal Annualized | Real Annualized |
| 01/03/94 | 534.59% | 290.10% | 9.43% | 6.86% |
| 01/02/14 | 9.49% | 8.07% | 19.95% | 16.85% |
Not bad, eh? Right around 7% on top of inflation, just about around the S&P 500's all time average returns (dividends reinvested, of course). Now, we're on record as saying that, in the short term, we don't expect large gains from the markets - and if the market does grow 15+% as the annualized returns show, we'll admit to being shocked.
But that's all about the shorter run. In the long run, at least in the last 2 decades and the 150 years or so before that, the stock market has been a good steward of your dough over the long term. So although we are pessimistic about huge returns continuing in the immediate future, we still believe that over the long term it's all about stock - how about you?
