

Dave Ramsey is a controversial figure in the Finance realm, at least in blogs, discussion boards, and Twitter. However, Dave Ramsey's investment advice doesn't usually cause the controversy. Most of the push-back on Dave comes from his advocacy of a psychological debt payoff method known as the "Debt Snowball".
What is the debt snowball?
The Debt Snowball is a form of debt pay-down where you pay off your debts in the order of the lowest account balances regardless of APR. While mathematically inferior to paying off high interest debt, it's psychologically easier for many people.
Why are people mad at Dave Ramsey's investment advice?
Dave Ramsey tweeted (since deleted) about how everyone should become a millionaire because investments return 12%.
Saving only $100 per month from age 25 to age 65 at 12% growth = $1,176,000. Everyone should retire a millionaire!
— Dave Ramsey (@DaveRamsey) February 12, 2013 (Ed: deleted)
Unfortunately, 12% is a very rare return on stocks over a long time period. Over a 30-40 year career, it's almost unheard of.
It's safer to look at a return of around 6% after inflation or 9% before – more on that in a few.
Who is Dave Ramsey?
Mr. Ramsey is one of the most famous Personal Finance authors in the field today, and an esteemed TV guest and radio star to boot. According to Wikipedia, he once filed for bankruptcy due to financial issues in the 1980s, and according to the Tennessee Department of Commerce and Insurance he held an insurance sales license from 1984 to 1996.
His Personal Finance empire is the outcropping of financial counseling he started for couples at his church. He started to attend seminars and eventually developed his own style and methods... which rounded into the Dave Ramsey cult of personality that exists today.
Bestselling author, radio host, TV personality, Christian? You better believe that a lot of people have an opinion about him.
Dave Ramsey's Investment Advice: The Reactions
Most people took exception to Dave's return figure - the 12% number (here's one angry reaction from Mandi Woodruff at Business Insider).
Now, the S&P 500 may often return more than 12% in a single year. But, everyone reading this obviously still remembers the issues with the stock market during the Great Recession. Remember that huge drop?
So, was 12% too optimistic? Luckily for you, this was a question we were born to answer!
Wwe developed a tool to let you figure out the returns of the S&P 500 over any time period using data provided by Robert Shiller on his website.
Let's evaluate Mr. Ramsey's comment with the S&P 500 in mind. It's the most popular benchmark in the United States, and also happens to have tons of index funds and mutual funds and other ways to invest in it. It's fair to say that most people have access to an S&P 500 index fund or some other means to invest in the index's components.
Editor: We've also put our S&P 500 trailing returns calculations into a tool you can use.
The S&P 500's Trailing 40 Year Geometric Average Returns
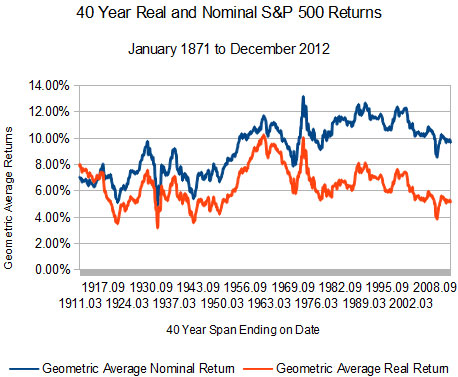
Graphed above are the 1,224 40 year periods in our data-set, which we built by including every month from January 1871 to December 2012.
The number shown is the geometric average return of reinvested dividends over that period. I calculated both nominal return and real (inflation-adjusted) returns, using the CPI reading also provided by Shiller.
(A note on methodology: if you reproduce the set, when you count dividends makes a difference. I also assume 0% taxes and $0 transaction fees. Coase would be proud.)
You don't even need to see the numbers to recognize that there wasn't a single period in the data-set with over a 12% real return.
There are, however, periods with nominal returns over 12% - 68, to be exact (5.56% of the time). Here's a summary of the results:
| Nominal Returns | Real Returns | |
| Average Return | 9.27% | 6.42% |
| Standard Deviation | 1.95% | 1.39% |
| Minimum | 4.88% | 3.17% |
| Maximum | 13.21% | 10.29% |
| Over 12% | 5.56% | 0.00% |
| Over 10% | 46.00% | 0.82% |
| Over 8% | 66.34% | 12.09% |
| Over 6% | 96.65% | 56.29% |
Dave Ramsey's Investment Advice vs. Nominal and Real S&P 500 40 Year Returns
Here's that same graph ordered from lowest returns to highest returns, so you can see just how rare 12% trailing returns were on the S&P 500 over the last 102 years:

Assuming that most people are talking about the S&P 500 when they talk about the market, it's just as rare to have 12% trailing returns as returns less than 6%.
Misguided Complaints about Mr. Ramsey?
Okay, so 12% returns are a little too ambitious.
If you retired in December 0f 2012 after 40 years in the markets (defined as the S&P 500, of course) you would have experienced geometric averages of 9.68% nominal and 5.16% real returns.
If you invested $100 a month starting in December 1973 (and reinvested dividends) in a magical fund with no transaction fees and no taxes that tracked the S&P 500 index perfectly? I did the math for you - you'd have $636,758.95.
It begs the question, however - why do people get mad at Dave's tweet encouraging financial discipline? It seems that, perhaps, you shot for the stars and ended up on the moon.
Isn't that better than earth?
(And before you ask - to get to $1,000,000 with that above fantasy fund you would have needed to invest $157.05 a month).
Dave Ramsey's Investment Advice: He Was Right, In a Way
Well, he's wrong about the 12% thing. 12% is too high a benchmark for you to set your expectations.
However, "Everyone should retire a millionaire!" rings completely true!
If you aren't investing now, get on it. I don't care how you do it - a giant lump sum, periodic monthly investments - just put your money to work for you.
Even if you don't make 12% in your accounts over a career, you'll still have a lot more money than if you try to start a flame war with Dave on Twitter.
That's valuable time you can use for earning more money towards your investments.
