
We've recently fielded a few questions similar to this one:
As of today (September 2, 2015 Close), the S&P 500 is down 5.34% on the year. What would it be down if you reinvested dividends and adjusted for inflation?
We've been relatively quiet on this one for a simple reason: once you factor in inflation in the form of CPI, and the various dividends that S&P 500 constituents have paid out you'd be looking at a return of roughly:
-5.62%.
Not a huge difference there... for this particular stretch of time.
Inflating and Adjusting, Is There Really Another Way?
We've made the case many times here on this site, and our point remains: for an accurate reading of how your investments have performed, you should both adjust for inflation and factor in whatever dividends have been paid out. It's okay, we understand - that math can be hard or annoying to perform (we've got you covered, though: try our calculators on the S&P 500 or the Dow Jones Industrial Average and many more). But discomfort of opening a spreadsheet program aside, it's the right way to do things.
Remember: you will both spend that eventual investment money under the inflation conditions of the time you sell (closer to the present than when you made the investment), and most people aren't in the habit of using their dividend checks to heat their homes... they either spend them or reinvest them. Over 2015, however, it's just a fluke of the inflation and dividend math which makes the results so close through the first 8 months of the year.
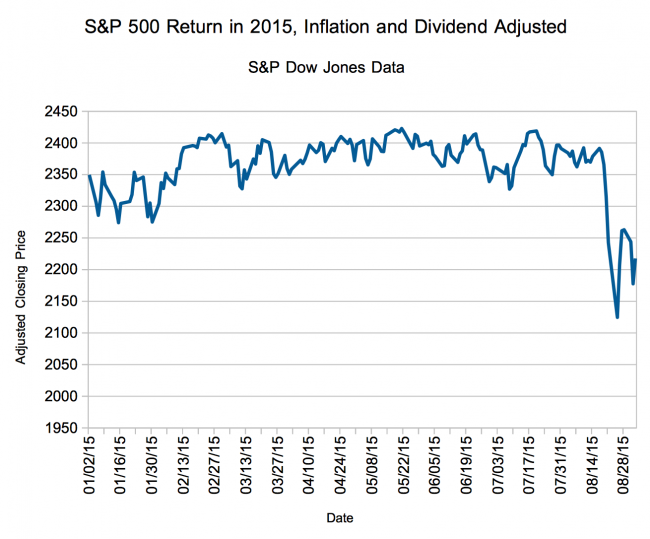
Sure, it's boring... but here's what that inflation adjusted and dividend reinvested S&P 500 buy on January 2, 2015 would look like so far this year (daily CPI methodology can be found on our daily inflation calculator, total return data is from the S&P 500 Total Return Index, from S&P Dow Jones Indices)
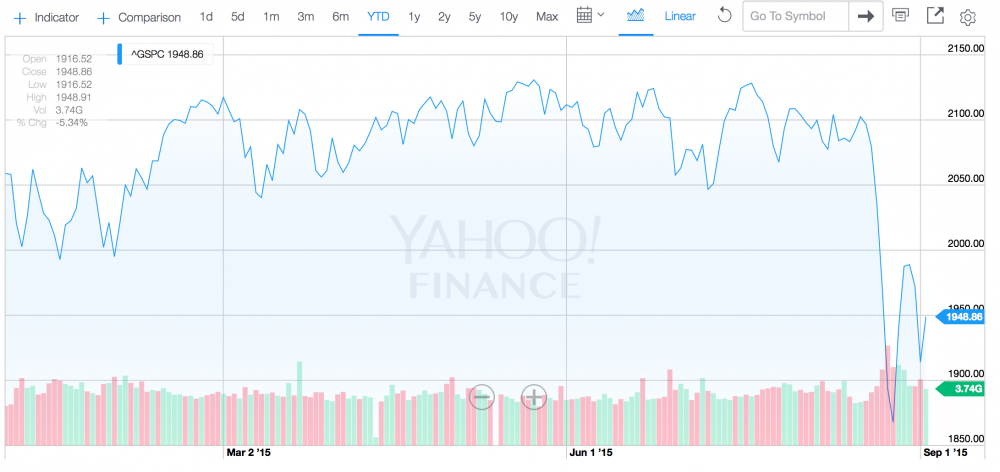
Compare that to the non-adjusted chart, and you'll see why I've resisted posting on this recently:
Your Plans?
We've said many times on this site: for most investors, your best move is to ignore the noise and invest in low cost index funds. Generally, especially over longer time periods, you'll see a greater divergence between the two charts - adding dividends back into your calculations makes a huge difference in your investment returns over time.
It just didn't make a huge difference this time.
