
We created this S&P 500 Historical Returns calculator to show the past returns on the S&P 500 over various timeframes. We've converted Robert Shiller's S&P 500 data from 1871 into geometric average trailing annual returns for 40, 20, 10, 5, and 1 year periods.
The tool includes both nominal returns and returns after inflation - and all results include dividend reinvestment.
S&P 500 Historical Return Tool
S&P 500 Historical Returns versus Volatility
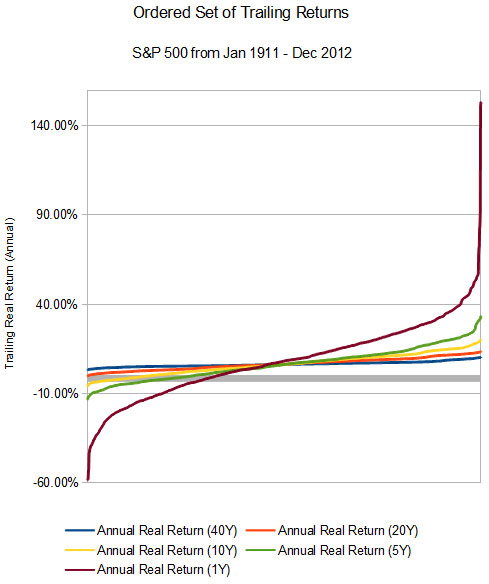
With the S&P 500 Index, the longer the time period:
- The greater the chance the dividend reinvested S&P 500 returned a positive result annually
- The lower the volatility
That second point makes a nice visual result. Here's all of the trailing inflation adjusted returns through 2012 presented visually:
How to Use The Historical Data
Most importantly: past returns are no guarantee of future performance.
With that in mind, history doesn't repeat itself but it often rhymes. This calculator shows if your estimated investment returns 'make sense' from a historic point of view.
This calculator's results don't mean that a given return is impossible to reach, nor does it set a floor on returns. It's possible, if not probable, that you might do worse than the returns indicated.
The data is best viewed as a guide, so you'll know what is reasonable to expect in the future. Remember: it's better to be conservative and have too much than overly optimistic and have too little.
This is also a tool you can use to check your asset allocation when you have specific savings goals.
For example, if you're buying a house in the next year, the S&P 500 has only returned more than 0% after inflation 67.91% of the time. The longer your investment horizon, the surer you can be you'll have a positive return.
Methodology for the S&P 500 Historical Returns
Importantly, the calculations to create this data were done assuming no taxes, no transaction fees, and no management fees.
You can read the whole methodology in the S&P 500 Return Calculator's methodology section, and look up individual time periods.
