
Lost among all the discussion about the Federal Reserve is an interesting question: is there a bound on the behavior of the Fed? Enter the Taylor Rule (background) and the Taylor Rule calculator, which you can find on this page.
What is the Taylor Rule?
First proposed by Economist John B. Taylor in 1993, the Taylor Rule algorithmically describes the past behavior of the Federal Reserve. Second, it is normative: after factoring in some assumptions, it gives a description for how a central bank should chart policy.
Taylor Rule Calculator: Simulate the Fed
Iterations of the Taylor Rule
The Federal Reserve in the United States and Central Bankers all over the world generally have a very important role in the economies of their countries: they set the short-term nominal interest rate. In the United States, that rate is known as the Federal Funds Rate, and here it directly refers to the (uncollateralized) rate at which depository institutions trade with the Federal Reserve in the United States.
Additionally, Central Bankers try to influence the effective federal funds rate by participating in Open Market Operations - literally, buying and selling securities to manipulate rates (and target the rates they have publicly declared).
The Taylor Rule uses a few widely available pieces of data - a measure of 'Output', a measure of 'Potential Output' and a measure of inflation in order to suggest a target nominal interest rate. Taylor's original rule was:
N = I + E + i(T - I) + o(P - O)
N = Suggested Nominal Interest Rate
I = Current Inflation
E = The Equilibrium Real Interest Rate
i = Inflation Coefficient
T = Target Inflation Rate
o = Output Coefficient
P = Potential Output
O = Current OutputGenerally, it was suggested that i = o = 0.5, and E = T = 2 (as in 2%).
So, if you substitute 'GDP' for output and 'CPI' for inflation, you can see how the Fed might get a handle on rates.
Making a Taylor Rule Calculator
All that sounds well and good, but only the most dedicated wonk would bother digging up the information to look at past rate decisions - right? Well, yes, and some very smart people have explored the Taylor Rule versus two times we know policy was wrong - in the 1970s and in the 2000s ('Stagflation' and 'Real Estate Bubble', if you want to put a name to them).
Well, the success of the St. Louis Federal Reserve's FRED APIs combined with your favorite computer engineer's interests has led to a calculator where you can be a central banker and manipulate the Taylor Rate back through 1956.
Here's what that calculator looks like:
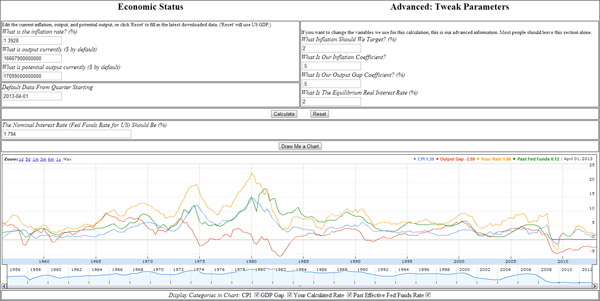
This calculator automatically updates on the first of every month with all of that glorious data you need to make smart policy decisions.
Of course, most of the data only updates once a quarter - so pay close attention to the 'Default Data From Quarter' field (that tells you how stale the data is). Also, remember you're working with more data than the Fed had at the time - much of this data is revised from original releases.
Step one, of course, is to fill in your assumptions. By default, it will load GDP and Potential GDP into the output fields and CPI into the Inflation field (and populate the advanced section with the data above).
Here's what everything means:
- What is the inflation rate? - Enter a number. We're using the annual inflation from the matching quarter of last year.
- What is output currently? - We use GDP. People have used everything from GDP to employment.
- What is potential output currently? - We use the CBO's Potential GDP figures. Use the equivalent for whatever you use above.
Advanced Parameters
I'm not going to explain these. See the variables descriptions above.
Calculate and Reset
Calculate will take whatever data is loaded and suggest to you a nominal interest rate. Take that rate and bring it back to your central bank colleagues (you're welcome). 'Reset' will reload the data that was pre-populated when you opened the calculator.
Draw Me a Chart (America & GDP only!)
Once you are done tweaking the variables, you can see how your personal tweaks to the Taylor Rule would have affected policy in the past. It uses GDP and Potential GDP in the data-set (since 1956, Q1), along with CPI for inflation. You will see the effective Federal Funds Rate versus the Rate we calculated you would have set for the nominal interest rates.
How did you do?
Sources for the Taylor Rule Calculator
Everything is pulled automatically once a month from FRED. If the data is old, wait until the 1st of the next month - I do not update it manually. If you hate the data, complain over there - there's nothing I can do.
- CPI - OECD, "Main Economic Indicators - complete database", Main Economic Indicators (database),http://dx.doi.org/10.1787/data-00052-en (Accessed on the first of last month). Copyright OECD. Reprinted with permission.
- Potential GDP - Congressional Budget Office
- GDP - Bureau of Economic Analysis
- Fed Funds Effective Rate - Board of Governors of the Federal Reserve System
